Stop Guessing What to Build: The Kano Method for Data-Driven Product Decisions
The article explains how the Kano Method helps product teams use customer feedback to categorize features and make data-driven decisions, prioritizing must-haves, performance boosters, and delighting features while avoiding wasted effort on indifferent ones.
TOPICS
Research
UX Strategy
SHARE
Anticipating customer preferences has become crucial for business success within our fast-paced competitive world. It’s 2025 and yet most product strategy still operates on assumptions, internal opinions, gap analysis, the boss’s gut feeling. It’s the feature factory trap.
Enter the Kano Analysis: a quantitative way of evaluating features while they're still on the drawing board, grounded in real user feedback.
A Kano Analysis strategically improves a product or service by revealing:
what are must-haves that will kill adoption if missing
where you need pristine design and constant refinement
features that deployed quickly, with less sophistication still delight customers
Thus, the insights of a Kano Analysis help you:
🔀 do strategic roadmap prioritization
💰 determine the right level of investment for each feature
⛔ gain data to kill bad ideas early before wasting resources
Kano Analysis 101
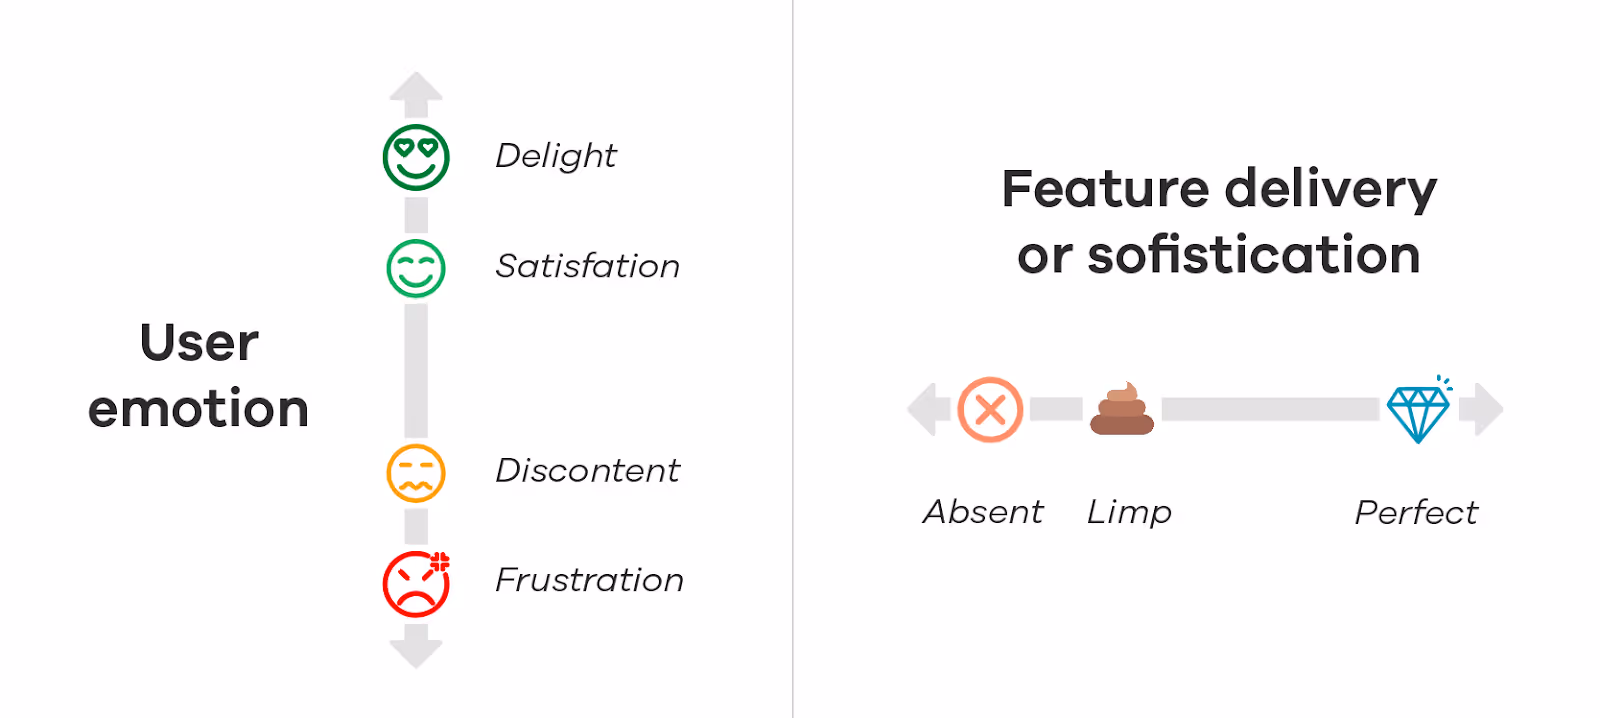
Developed by professor Noriaki Kano this technique fosters customer loyalty by understanding how features impact user emotions:
How much ☺️ satisfaction a feature brings when present
How much 😠 frustration it causes when absent or poorly implemented
Some examples to illustrate:
How do you feel about a slow home banking app?
How do you feel when you're upgraded to first class?
How does the receptionist's attitude affect your opinion of a hotel?
How do you feel about e-commerce with no free shipping?
A short survey with representative customers measures these satisfaction and frustration potentials. Apply a formula to the answers (more on this below) and you get something like this:
“Not all are born equal.”
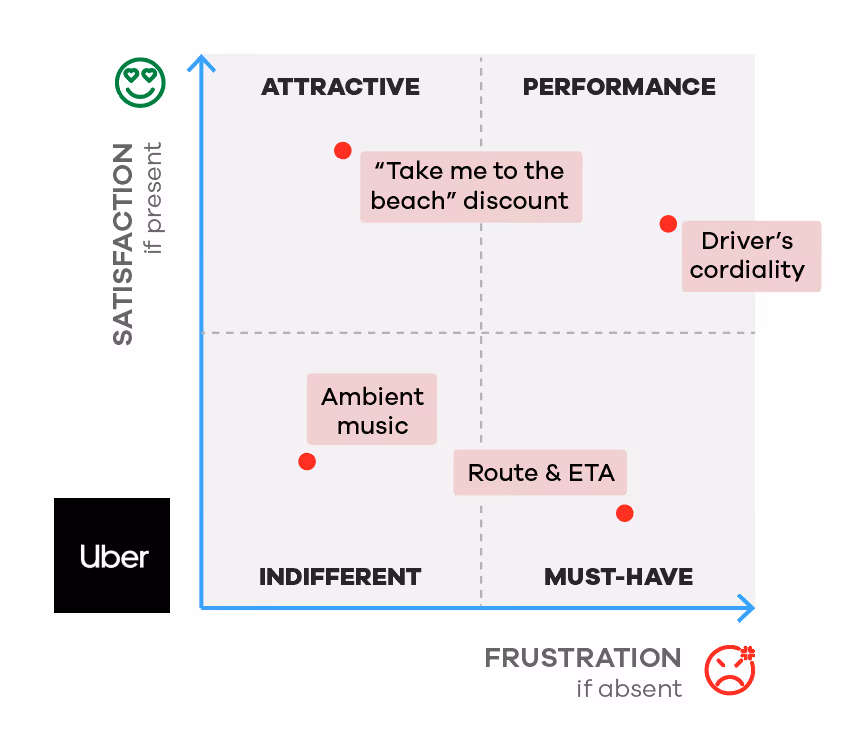
As the diagram above shows, not all features impact users the same way - it's all about expectations. Features provoke different emotional responses:
🤩 ATTRACTIVE A complimentary drink. A reminder about tickets for a sold-out concert. Unexpected delights that don't need sophistication. Users won't miss them when absent, but they'll remember them when present.
📈 PERFORMANCE Video quality at your cinema. Budgeting features in your banking app. Desired qualities where better execution means more satisfaction (and vice versa). These are the battlegrounds of competitive advantage.
✅ MUST-HAVE Punctual trains. Apps that don't crash… Basic expectations that never make customers happy but generate significant frustration when missing or poorly implemented (think shipping costs or cumbersome checkouts).
😐INDIFFERENT Ideas that seemed brilliant during brainstorming but mean little to the average user. The graveyard of unnecessary features.
The 3 Strategic Virtues of a Kano Analysis
Different user expectations mean different feature priorities. From a business strategy perspective, Kano supports product owners in three critical ways:
1. PROJECT PRIORITIZATION 🔝
"Must-Have" features missing from your product need implementation ASAP. Launching an MVP without them guarantees poor adoption.
Mix "Attractive" features into every release to boost delight with lower development effort. But if your project goes off the rails, these are the first to postpone as they won't be missed.
2. RESOURCE ALLOCATION 👥
Whether it's research, design, development, QA, or marketing effort - knowing satisfaction and frustration levels helps you balance perfection against time-to-market.
"Must-Have" and "Performance" features demand top-notch UX and continuous improvement. They're not one-off implementations you can forget about.
"Attractive" features can and should be deployed with less sophistication. Speed matters more than polish here.
3. FILTERING BAD IDEAS 🗑️
"Indifferent" features are, well... indifferent. Generating ideas is important, but scrutinizing them early is equally crucial.
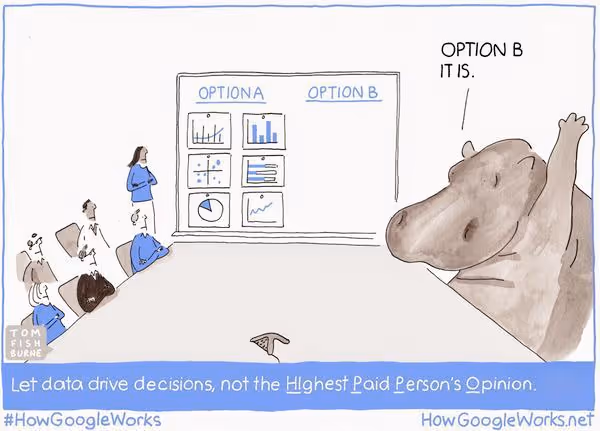
Kano provides external data to counterbalance the internal assumptions commonly plagued by HIPPOs or blind GAP Analysis that result in progressive Experience Rot.
Remember: designing, developing, and maintaining useless features costs more than you'll ever know.
A tool with broad scope
Kano modeling works across industries - mobile apps, automotive, medical insurance, you name it. Use it to evaluate:
Current features of an existing service
User stories in your project backlog
Potential ideas and solutions
Insights from benchmarks and gap analysis
A new product or touchpoint
Merging or separating products
It works brilliantly alongside other strategy tools: Value Proposition Canvas, "How Might We" exercises, and Value-Effort Matrices.
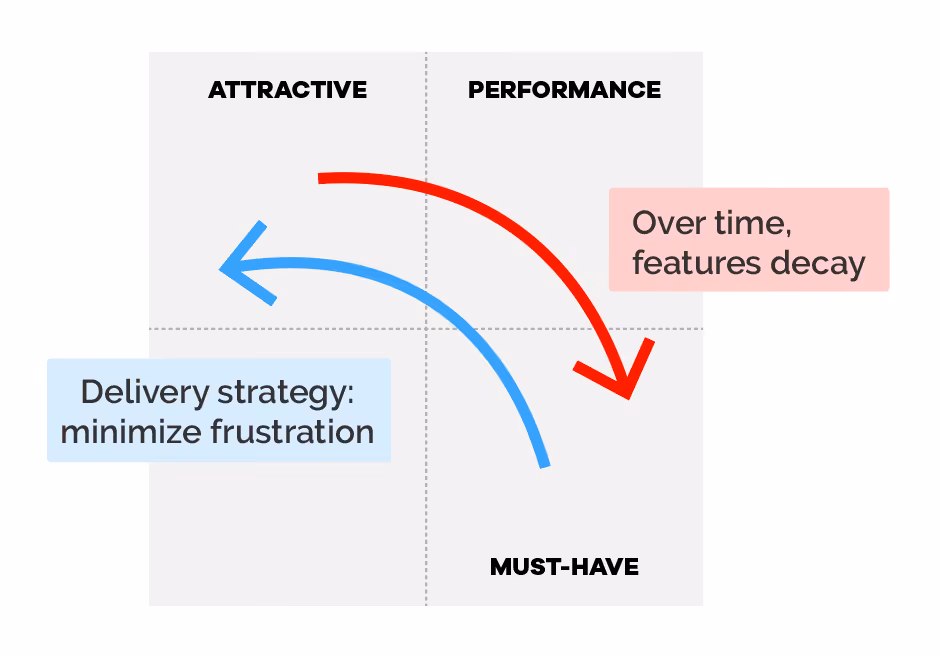
Over Time, Features Lose Their “Wow”
Think about hotel 🛜. Remember the surprise and delight you felt a decade ago, surfing the web in a hotel's lobby? Now, does a 200 Mbps connection in your room make you happy, or is it just... invisible?
Over time, features migrate: Attractive → Performance → Must-Have.
Here's what this means for product strategy:
Don't postpone Attractive features too long, or you'll miss the window to deploy them crudely and still get credit
Prioritize improvements in Performance features so users continue deriving satisfaction from them
Theory tells us to minimize frustration first: work on "Must-Have" features, then "Performance", then "Attractive". In practice, however, an MVP or new version needs to balance features across all Kano categories. Why? Because:
Great UX means both expected functionality and unexpected delight.
And factors like implementation effort, revenue potential, and technical dependencies matter too.There's no simple out-of-the-box recipe. This is why strategic UX workshops are essential.
How to conduct a Kano Analysis?
At its core, a Kano study is a quantitative survey real users respond to. The process has 7 steps:
Gather a list of attributes and features
Build an online survey
Users interact with the feature (optional but recommended)
Apply the survey
Calculate the results
Extract insights
Run a strategy workshop
1. Gather a List of Attributes or Features
Start with a focused list (max. 20) of your most important assumptions:
New features from ideation sessions with diverse stakeholders, quick AI prompts, in-depth UX research
Ideas directly from users via lean approaches like Slido, where users simultaneously suggest and vote on ideas in real time.
Current features of an existing product - don't forget aspects users perceive as "qualities": punctuality, speed, responsive design, offline use, 24/7 support.
2. Build a survey
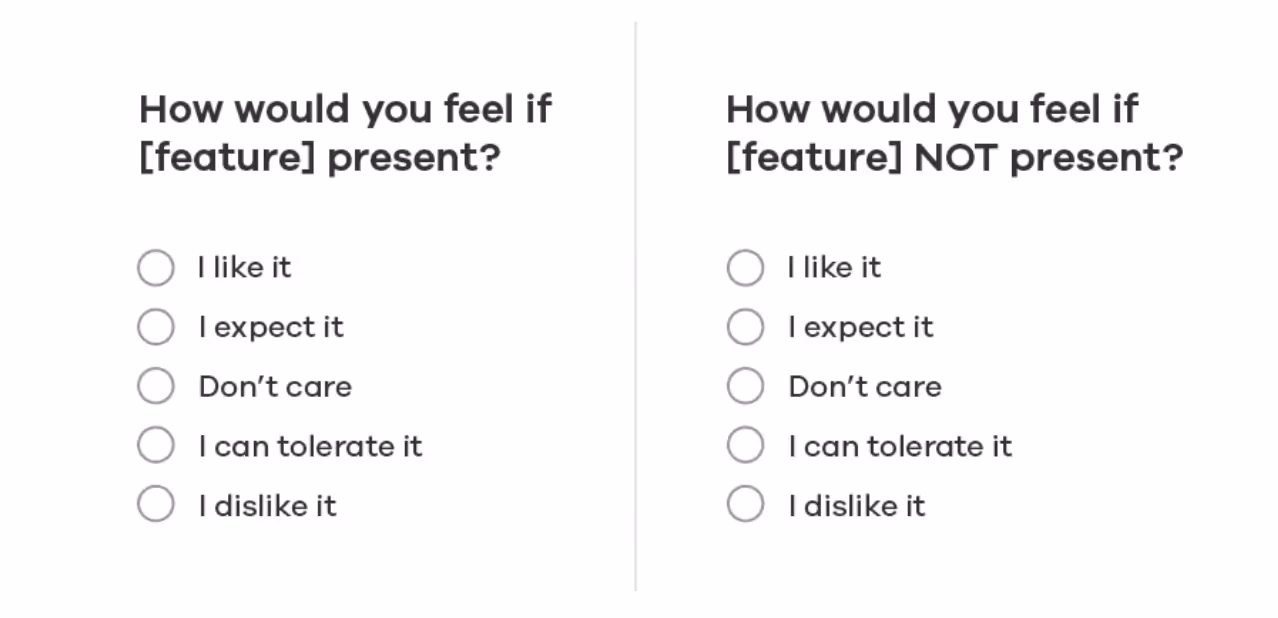
It’s a simple survey, with two questions per feature:
Budget: Google Forms + manual calculation in a spreadsheet
As with all user research activities, especially quantitative ones, ⚠️ never skip pilot testing with 4 or 5 users.
3. Users Interact with the Features (Optional but Recommended)
As Morpheus put it: "There's a difference between knowing the path and walking the path." So, if users can interact with a prototype before answering, results will be more accurate. This matters most when testing:
Abstract ideas
Whole sections or complete apps
For simpler things, a wireframe, sketch, photograph, or short text description suffices.
4. Apply the survey
Large sample size ensures statistical relevance:“There isn’t a one-size-fits all number; the right number depends on precision needed. Between 50-300 participants provides a margin of error between 5%-9%.” - Jeff Sauro
When and how to recruit:
Intercept current users when evaluating existing features. Tools like Survey Monkey let you intercept site visitors without coding, with controls (show to 5% of visitors) and customization (branding).
Online recruitment panels for brand new products. Services like UserInterviews or local agencies (in Portugal, we’re ❤️ Pontis).
After usability testing when measuring UX of a new release. At the end of each session, query participants about upcoming features.
Guerrilla style for mass market products or specific subcultures. Spend a day at a university campus or train station with a tablet or QR code.
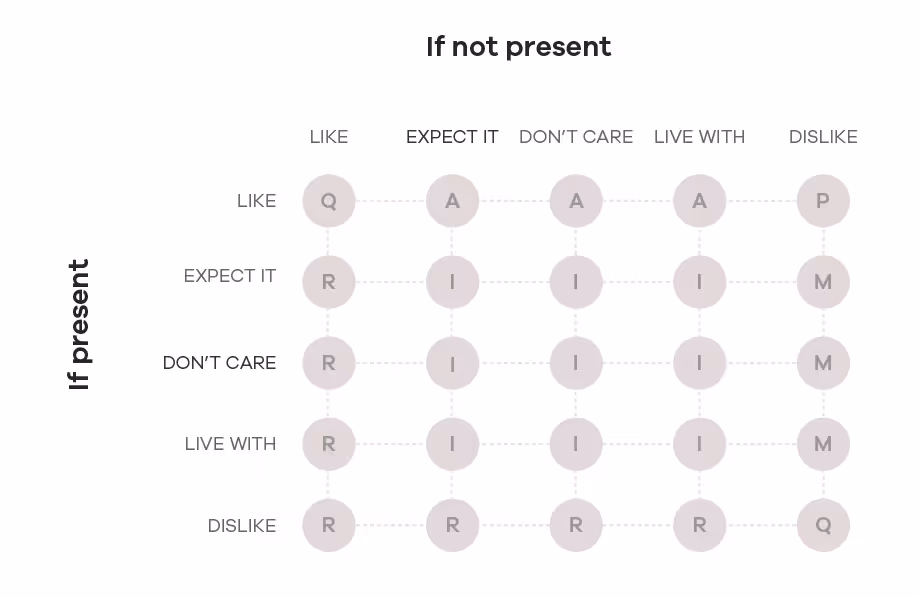
5. Calculate the results
This matrix determines whether a feature is "Must-Have", "Performance", "Attractive", or "Indifferent".
The process:
Take feature #1 from your survey
For participant #1, cross-reference their positive and negative answers in the matrix
Repeat for all participants
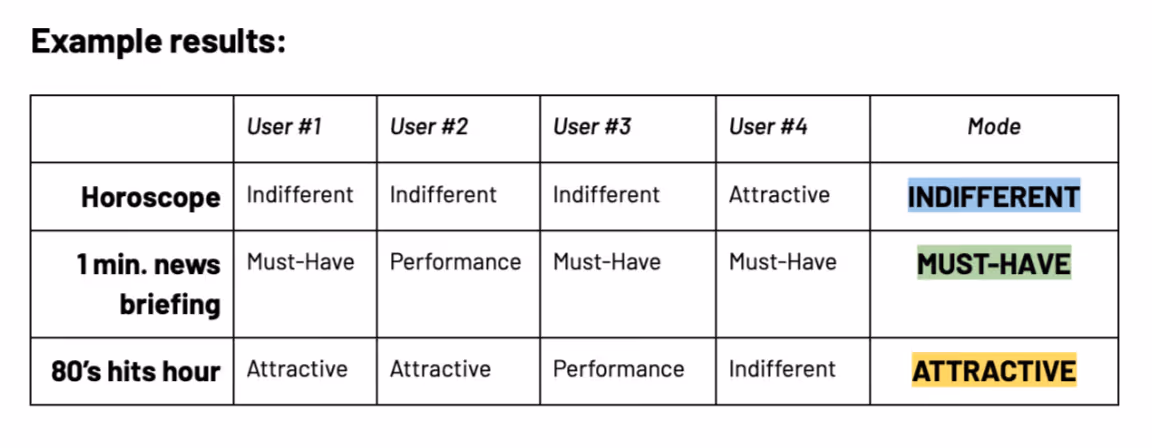
Take the mode (most frequent category) across all participants
Repeat for all features
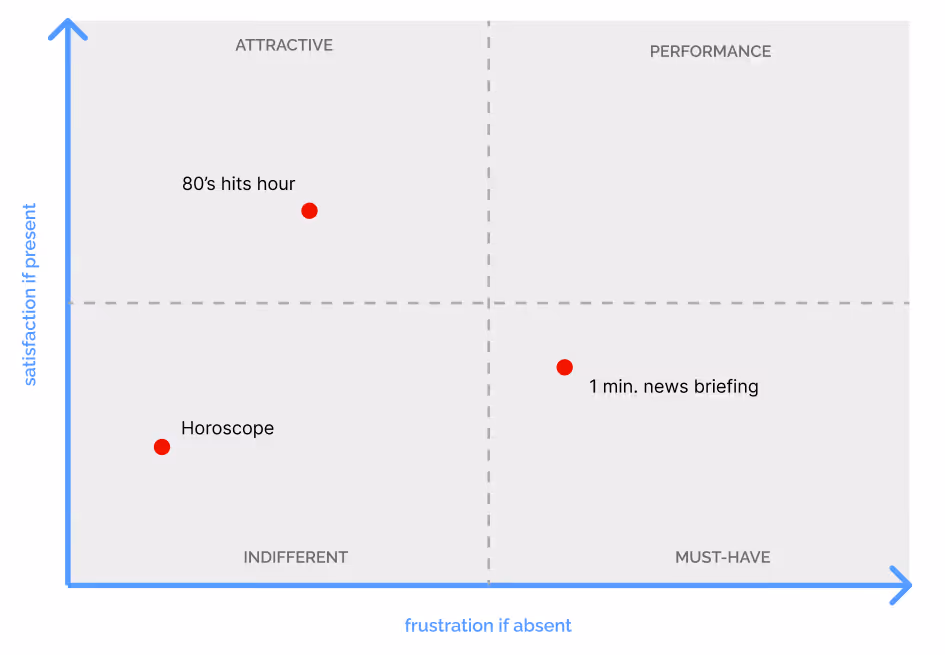
An alternative, more sophisticated approach is Mike Timko’s continuous Analysis - offers a visual map that plots satisfaction vs. frustration levels using the formula: Better score = (A + P) / (A + P + M + I) Worse score = -1 × (M + P) / (A + P + M + I).
6. Extract insights
From the Kano categorization and the continuous analysis map, you can now extract actionable insights:
🌟 Identify Quick Wins "Attractive" features with low implementation effort are your golden opportunities. They deliver disproportionate delight with minimal investment - perfect for your next sprint.
⚠️ Spot Critical Gaps Missing "Must-Have" features? Red flag. These are non-negotiables that will tank your product's adoption. Address them immediately.
🧐 Challenge Your Roadmap Compare your current priorities against the Kano results. This exercise often reveals misalignment between what stakeholders think matters and what users actually care about.
👥 Understand the Nuances If a feature shows mixed results (e.g., 40% "Attractive", 35% "Indifferent"), you may have different user segments with distinct needs. This is gold for personalization strategies.
💼 Map the Competitive Landscape Are your competitors "Performance" features better than yours? Kano helps you understand not just what to build, but where to focus your quality efforts to gain competitive advantage.
7. Run a strategy workshop
Gather the core team - product owners, designers, developers, and key stakeholders - for a focused workshop.
Present the Results Clearly Start with the big picture: show the Kano categorization of all features. Use the continuous analysis map for visual impact. Highlight surprises and patterns that emerged from the data.
Facilitate, Don't Dictate Create shared understanding by ask questions like: "What surprises you about these results?" or "How does this challenge our current roadmap?"
Balance Multiple Factors Implementation effort - via a Value-Effort Matrix Business impact - revenue potential, strategic alignment Technical dependencies - what needs to be built first Market timing - windows of opportunity
Align Decisions and Define Next Steps Which "Must-Have" features will we prioritize this quarter? What's the minimal viable implementation for our "Attractive" features? Which "Indifferent" ideas are we brave enough to kill? How will we allocate UX research and design resources?
Schedule a Follow up As Kano teaches us: expectations evolve. Do another analysis in 12-18 months.
Kano Analysis at Tangível
At Tangível, we've used this sophisticated technique across diverse contexts and industries:
Improving taxi ride experiences for mobility startups
Optimizing delivery processes in e-commerce platforms
Enhancing internal communication tools in corporate environments
Innovating features in digital banking and insurance products
Help decide to merge products and to bundle subscriptions
What sets our approach apart is the rigor we bring to the process. We don't just run surveys - we ensure participants interact with prototypes, we carefully craft feature descriptions to avoid ambiguity, we filter the results by customer segment, and we facilitate workshops that turn data into strategy.
--
As William Shakespeare wisely noted: "Expectation is the root of all heartache." Understanding and managing those expectations is the foundation of great user experience. When you tie product features to the emotional responses they evoke, you gain the power to separate products that merely function from products that people truly love.
If you're struggling to prioritize your roadmap, questioning whether your next big feature is worth the investment, or wondering if your brave MVP will resonate with users, at Tangível we help businesses make smarter product decisions - let's talk!


.avif)